可观测性与遥测
Grafana 堆栈与 Prometheus 集成
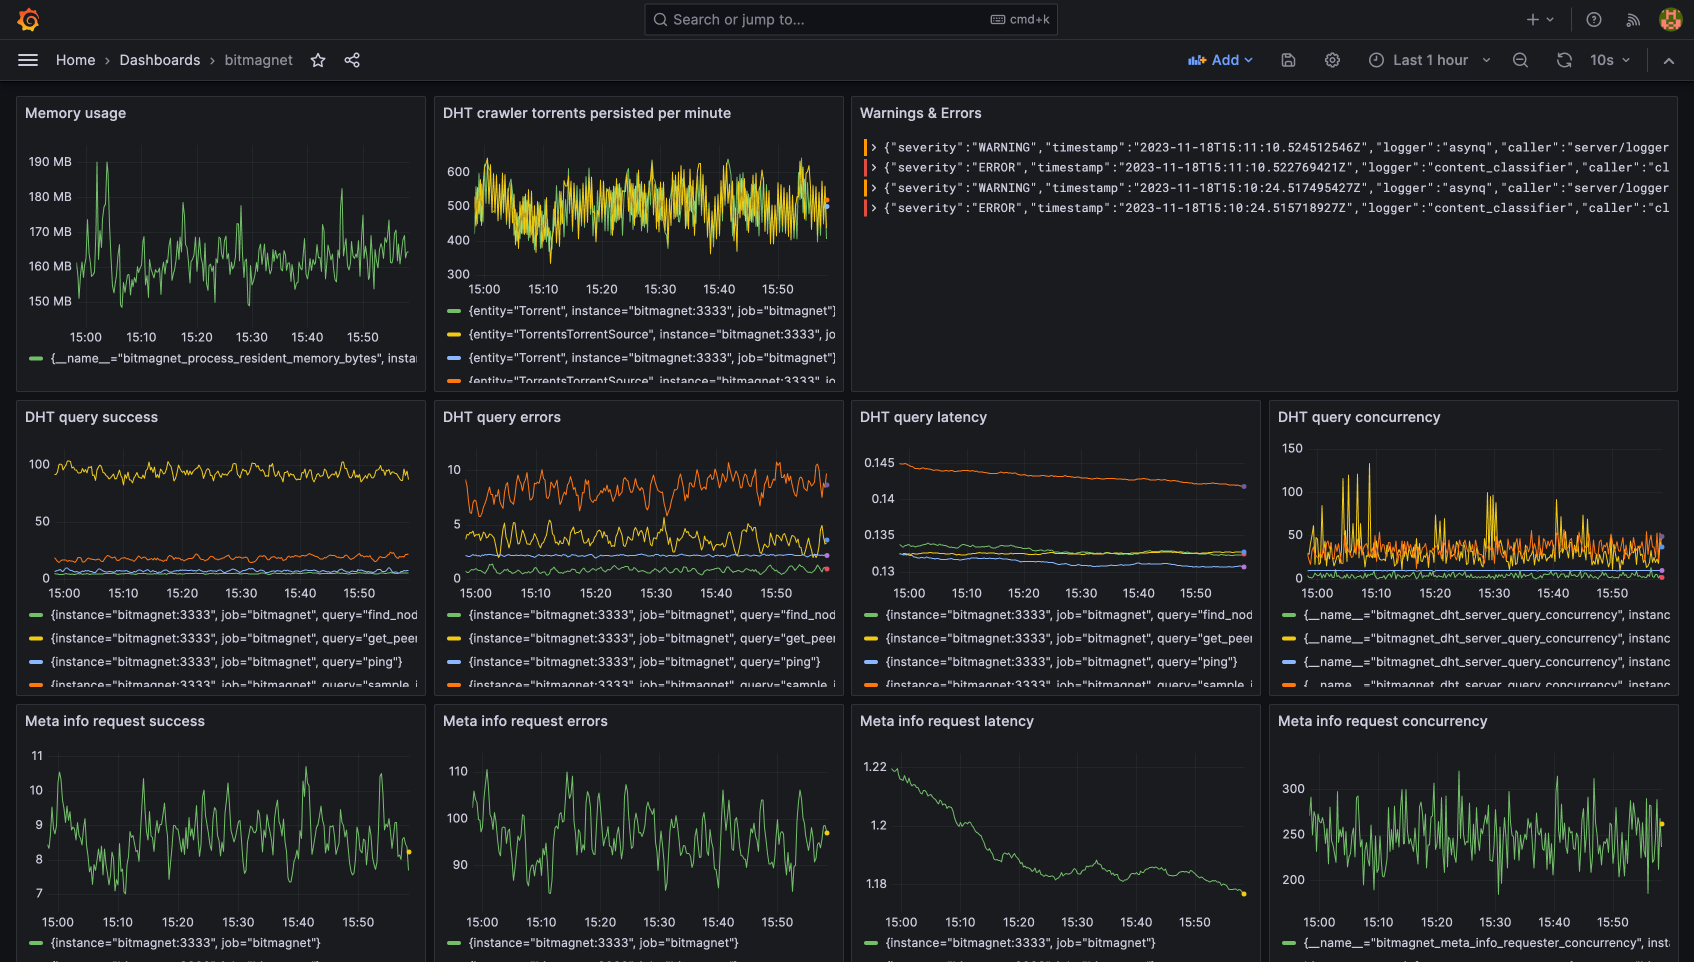
bitmagnet 可以与 Grafana 堆栈 和 Prometheus 集成,用于监控和为 DHT 爬虫及其他组件构建可观测性仪表盘。请参阅 示例 docker compose 配置 的“可选可观测性服务”部分,以及示例 Grafana / Prometheus 配置文件和预配置的 Grafana 仪表盘。
示例集成包括:
- Grafana - 仪表盘和可视化工具
- Grafana Agent - 收集指标和日志,并转发到存储后端
- Prometheus - 指标的时序数据库
- Loki - 日志聚合系统
- Pyroscope - 持续分析工具
- Postgres exporter - 向 Prometheus 暴露 Postgres 指标
使用 pprof 进行性能分析
bitmagnet 在 /debug/pprof/* 处暴露了 Go pprof 性能分析端点,例如:
go tool pprof http://localhost:3333/debug/pprof/heap